Analyzing Canada as the 51st State: A Customer Experience Analytics Perspective
Customer experience (CX) analytics is not only a tool for businesses but also offers valuable insights into socio-economic comparisons. By examining Canada’s potential as the 51st state, we can highlight key aspects of its economy, education, and safety compared to U.S. states. This analysis showcases the potential challenges and advantages, providing actionable insights for policymakers, citizens, and businesses.
Introduction to “Canada as the 51st State”
The hypothetical proposition of Canada becoming the 51st state provides a unique opportunity for CX analytics. It reveals how comparing data from two neighboring nations can uncover disparities, strengths, and potential synergies. In this scenario, Canada’s socio-economic attributes serve as critical touchpoints for evaluation.
Economic Insights: Canada’s Place in the U.S. Economic Landscape
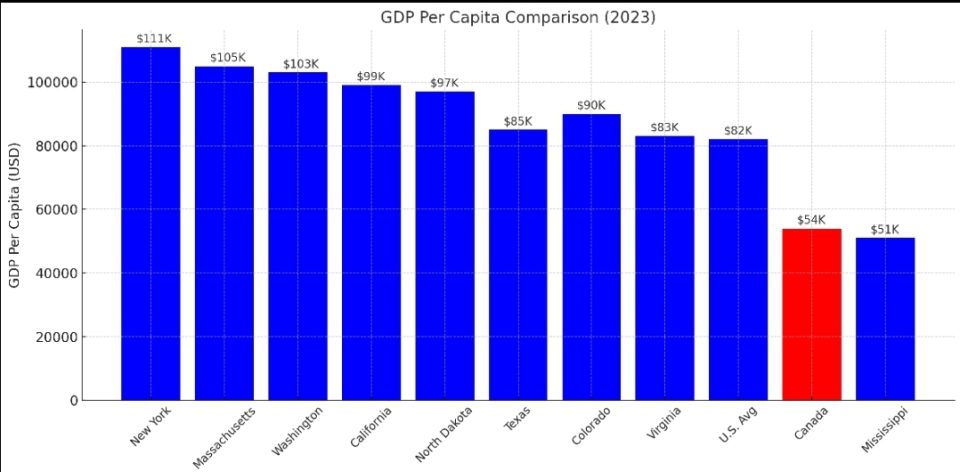
When viewed through an economic lens, Canada’s GDP paints an intriguing picture. With a per capita GDP of $54,000, Canada ranks second to last among U.S. states. Only Mississippi, at $51,000, falls behind. Although this position might seem disadvantageous, a deeper analysis reveals that Canada’s overall GDP outperforms most states. Specifically, it would rank fourth, trailing only California, Texas, and New York.
This contrast highlights a significant disparity: while Canada’s economy is robust in absolute terms, its individual wealth distribution requires attention. For businesses seeking expansion, these insights suggest that high aggregate demand exists but might be unevenly distributed across Canadian regions.
Education: A Key Differentiator
Education stands out as Canada’s strongest competitive advantage in this comparison. If it were part of the U.S., Canada would lead all states with 58% of adults holding college degrees. This far surpasses the U.S. average of 36%, setting Canada apart as an intellectual hub.
Educational attainment directly influences innovation, workforce quality, and economic productivity. For organizations aiming to tap into skilled labor markets, this data signals immense potential for growth and collaboration in Canada. However, the disparity between Canada’s education levels and its GDP per capita suggests possible underutilization of its highly educated population, warranting strategic policy interventions.
Safety and Crime: A Benchmark for Improvement
Canada’s crime statistics provide another angle for CX analytics. With a murder rate of only two per 100,000 people, Canada matches states like Utah, Rhode Island, and New Hampshire. These rates starkly contrast with the U.S. average of seven murders per 100,000 people. Such data positions Canada as one of the safest “states,” appealing to families, businesses, and individuals seeking secure environments.
Safety is a critical factor in quality of life and economic development. Lower crime rates typically correlate with higher property values, better tourism prospects, and stronger consumer confidence. For businesses, Canada’s safety metrics could signify reduced operational risks and higher employee satisfaction.
Life Expectancy: A Metric of Well-Being
Canada also excels in life expectancy, with an average of 81.7 years compared to the U.S. average of 77 years. This metric suggests better healthcare systems, lifestyle choices, and environmental factors in Canada. Life expectancy serves as a critical indicator of overall societal well-being, influencing both workforce productivity and consumer behavior.
From a CX perspective, these numbers reveal opportunities for industries like healthcare, wellness, and insurance to capitalize on a healthier, longer-living population. It also highlights areas where U.S. states could learn from Canada’s healthcare policies and public health initiatives.
Transitioning “Canada as the 51st State”: Challenges and Opportunities
While Canada offers significant advantages, several challenges must be addressed for seamless integration. Its lower GDP per capita highlights economic inequalities that could hinder growth. Moreover, cultural differences and political dynamics would require careful consideration.
Despite these hurdles, Canada’s exceptional educational attainment and safety records present unparalleled opportunities. U.S. states could benefit from Canada’s best practices in education and crime reduction, creating mutually beneficial learning exchanges.
CX Analytics Insights: Bridging Gaps and Driving Synergies
Using CX analytics, businesses and policymakers can identify and address the gaps revealed by this comparison. For instance:
- Tailored Economic Strategies: Canada’s relatively low GDP per capita suggests potential barriers in income distribution. By implementing region-specific economic initiatives, these gaps could be bridged effectively.
- Optimizing Talent Utilization: With Canada’s high education levels, businesses can explore strategies to maximize workforce productivity. This could include targeted investments in innovation hubs and skill development programs.
- Safety as a Selling Point: Canada’s low crime rates make it an attractive destination for businesses and individuals. Marketing this safety advantage could enhance tourism, migration, and investment.
- Healthcare Collaboration: Canada’s higher life expectancy points to the success of its healthcare system. U.S. states could adopt similar practices to improve public health outcomes.
Data Visualization: Making Insights Accessible
To effectively communicate these insights, visual tools such as heatmaps, bar charts, and scatter plots could be used. For instance, a bar chart comparing GDP per capita across states and Canada would highlight economic disparities. Similarly, a heatmap showing educational attainment could emphasize Canada’s leadership in this domain.

Conclusion: A Data-Driven Perspective on the “Canada as the 51st State”
In conclusion, viewing Canada as the 51st state offers invaluable lessons for both nations. By leveraging CX analytics, stakeholders can uncover actionable insights that drive economic, educational, and societal improvements. Although challenges exist, the data reveals opportunities for mutual growth and learning.
For businesses, understanding these metrics enables strategic decision-making, while for policymakers, it provides a roadmap for addressing disparities. As a hypothetical exercise, this comparison underscores the power of CX analytics in fostering meaningful, data-driven discussions.